
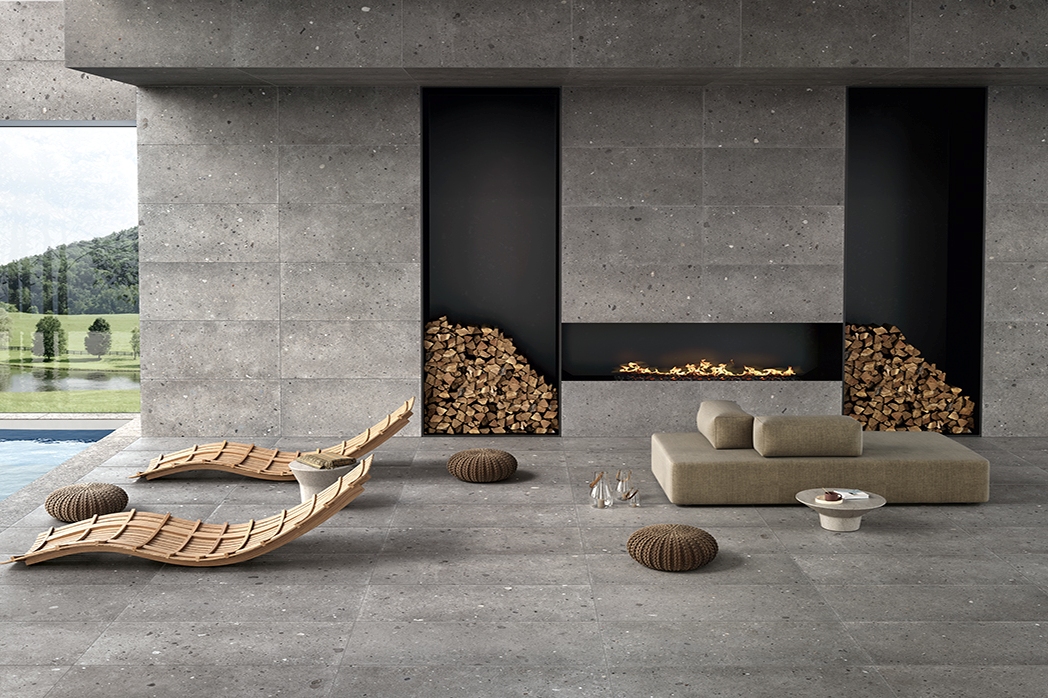
Category overview
Category report · New Zealand & Australia · 1 October 2025 to 30 September 2026 · every figure per market, never summed. This refresh continues the Category Report Library series in the same structure: the funnel top down, where the category is moving, who researches it, and supplier benchmarks. Aggregate-only and safe for external use; supplier distributions are suppressed for any market under five listed suppliers.
The Tiles & Stones funnel, top down
| Stage | New Zealand | Australia |
|---|---|---|
| All pageviews across the category’s suppliers | 367,094 | 294,198 |
| of which: views of the category’s product pages | 95,130 | 58,470 |
| Saves and downloads | 317 | 138 |
| Click-throughs to suppliers’ own websites | 5,197 | 2,511 |
| Pageviews measured on suppliers’ own websites (pixel) | 24,526 | 15,367 |
| Measured enquiries, both surfaces | 830 | 544 |
| of which: conversations on ArchiPro | 171 | 91 |
| of which: direct enquiries on suppliers’ own sites (pixel) | 659 | 453 |
Where the Tiles & Stones category is moving
Product-page views ran +36% in NZ and +68% in AU in the second half of the window against the first (April–September 2026 vs October 2025–March 2026, consistent series — part growth, part seasonal shape). Enquiry growth is deliberately not stated: pixel coverage expanded during the year, so the two surfaces are shown as levels with the split always visible rather than as a growth rate.
Who researches tiles & stones on ArchiPro
| Identified audience, four quarters | New Zealand | Australia |
|---|---|---|
| Design practices (A&D organisations) | 1,947 | 1,898 |
| Construction firms | 2,102 | 1,823 |
| Government & education workplaces | 2,310 | 1,590 |
| Residential audience (identified people) | 237,102 | 211,136 |
Tiles & Stones supplier benchmarks
| Benchmark | New Zealand | Australia |
|---|---|---|
| Suppliers listed · products | 42 · 1,678 | 24 · 1,973 |
| Category leader’s share of product-page attention | 15% | 12% |
| Top-3 suppliers, average products | 231 | 283 |
| Median supplier, product pageviews / yr | 532 | 1,663 |
| Top-quartile supplier, product pageviews / yr | 2,569 | 4,634 |
| Median supplier, enquiry conversations / yr | 3 | 2 |
| Top-decile supplier, enquiry conversations / yr | 8 | 11 |
Data source and method
Tiles & Stones — Category Report · September 2026 refresh · Region: NZ + AU · Method and scope: period: 1 October 2025 to 30 September 2026, every figure per market; category register from the live benchmark table (suppliers with nonzero category product pageviews in the window); all-pageviews from production event data, bots excluded; product-page views are per-supplier max-per-month then summed; saves, downloads, click-throughs, conversations and own-site (pixel) figures from the daily journey ledger over the category register; enquiries shown on both surfaces with the split always visible — pixel coverage expanded during the year, so enquiry growth is not stated; momentum compares April–September 2026 with October 2025–March 2026 inside the consistent series (a February 2025 measurement-basis change prevents honest cross-year comparison) and includes seasonal shape; audience counts are identified organisations and individuals over the four quarters, floors, client staff excluded; supplier distributions published only for markets with at least five listed suppliers, and no individual supplier is named. Aggregate data, safe for prospect use. Reproducible from source on request.
Source: Milot Zeqiri, ArchiPro. September 2026 refresh.
Download the Tiles & Stones Category Report PDF: October 2026 edition